Water Conservation Module
A utility’s green initiatives promote conserving and recycling. Customers are often reluctant to conserve because they see no direct consequences for not conserving. In an effort to provide customers a direct link to un-controlled usage habits, the Conservation Module was developed. The conservation module allows utilities to leverage budgeted rates to promote conservation practices among their consumer base. This is primarily used by water utilities located where water is considered a scarce resource. Budgeted – or allocated – rate structures are considered an alternative to water rationing. Consumers are allocated a location specific amount of water for which they will be charged the lowest per unit amount and once that amount is exceeded they are charged increasingly more per unit – often exponentially so.
NOTE: This document’s primary focus is on water; however the conservation principles described can be applied to any usage based service.
Types of Conservation
UMS provides two rate setups for promoting conservation, Conservation Tier by Month and Conservation Tier by Allocation. Both methods use an extended Consumption only based rate code setup but the setups and calculate process are very different. The operational characteristics are described in the following sections.
Tier by Month
If the Tier by Month conservation method is used, the maximum number of units is defined for each month for each tier. The maximum units per month are fixed for all customers assigned the rate code. The meter reading date is used to determine which month is used during bill calculation.
During months of higher demand, the maximum units per tier can be lowered on the first tier to encourage conservation. Higher consumption during high demand periods will bill more usage in the higher (penalty) tiers.
During periods of low demand, the maximum units per tier can be raised to allow more consumption at the lower rate. During the low demand periods, a customer could consume more before reaching the higher (penalty) tier.
Tier by Allocation
The Tier by Allocation calculates the maximum number of units in the tier. Using this conservation method, the customer’s specific information is used to determine the maximum number of units in the first tier. The allocations are defined as an Average or a Formula type. Average type allocations use historical usage data to determine the customer’s tiers. The Formula allocation uses an advanced calculation that combines 1 or more multiplying items (including demographic items and external values) to determine the customer’s tiers.
Tier by Month Setup
The Tier by Month requires the least amount of setup because the conservation is controlled by the rate code. Use the following steps to setup a Tier by Month rate code.
From the Setup Rate window, click Add
 to add a
rate code
to add a
rate codeIn the Select Rate type window, select Conservation Tier by Month as the Rate type and click OK
The new Conservation Tier by Month is displayed. This window is similar to the Consumption rate code window. The General, Fees and Taxes and the Consumption Details tabs require the same information as the Consumption rate
On the Consumption details tab, click Add
to add a
usage tier. The New Consumption Tier window is displayed. The
Consumption details at the top of the window are the same as the
details for a regular consumption rate tier
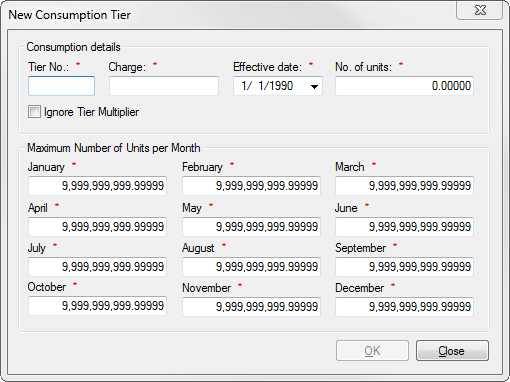
Figure 299: Adding Consumption Tiers
Enter the monthly maximum units for the tier for each month. The default value is 9,999,999,999.99999. The tier could look like the table below
Month |
Usage |
Month |
Usage |
Month |
Usage |
|---|---|---|---|---|---|
January |
1000 |
February |
800 |
March |
700 |
April |
700 |
May |
600 |
June |
500 |
July |
500 |
August |
500 |
September |
600 |
October |
700 |
November |
800 |
December |
1000 |
Table: Sample Tier by Month Settings
Figure 300: Default Usage by Month
Click OK
After all the tiers are added click OK to save
The example rate below shows how a customer’s bill would change during the year
Rate |
Jan |
Feb |
Mar |
Apr |
May |
Jun |
Jul |
Aug |
Sept |
Oct |
Nov |
Dec |
|---|---|---|---|---|---|---|---|---|---|---|---|---|
1.10 |
1000 |
800 |
700 |
700 |
600 |
500 |
500 |
500 |
600 |
700 |
800 |
1000 |
2.15 |
99999 |
99999 |
99999 |
99999 |
99999 |
99999 |
99999 |
99999 |
99999 |
99999 |
99999 |
99999 |
Usage |
900 |
900 |
900 |
900 |
900 |
900 |
900 |
900 |
900 |
900 |
900 |
900 |
Tier 1 |
$99.00 |
$88.00 |
$77.00 |
$77.00 |
$66.00 |
$55.00 |
$55.00 |
$55.00 |
$66.00 |
$77.00 |
$88.00 |
$99.00 |
Tier 2 |
$0.00 |
$21.50 |
$43.00 |
$43.00 |
$64.50 |
$86.00 |
$86.00 |
$86.00 |
$64.50 |
$43.00 |
$21.50 |
$0.00 |
Total |
$99.00 |
$109.50 |
$120.00 |
$120.00 |
$130.50 |
$141.00 |
$141.00 |
$141.00 |
$130.50 |
$120.00 |
$109.50 |
$99.00 |
Figure 301: Example of Billed Rates by Month
For this service, demand begins increasing in February with the peek demands during June, July and August. Beginning in September the demand decreases to its lowest levels by December. This cycle repeats from year to year. To encourage customer to conserve, the tier’s allowed usage changes with the demands for the service. The customer is bumped into the next tier after 500 units of use in the high demand summer months. In the low demand winter months, the customer can use almost double the units before being billed in the next tier.
Tier by Allocation
The Tier by Allocation conservation method requires more than a rate code setup. The allocation types have different requirements as well. Use the check list below to guide you through the setup requirements.
Formula Allocations
The formula allocation method uses demographic items assigned to the allocation details to calculate allocations. The customer’s demographic items values are assigned in the control panel. The specific values are used in the formula to create a customized allocation. Use the formula allocation checklist to guide you through the setup requirements.
Setup Checklist for Formula Allocations
Demographic Setup
Demographic Categories
Demographic Items
Allocation Setup
Allocation Type
Allocation Method Formula
Demographic type
Demographic item
Factors
Factor Value
Operation
Effective Dates
Rate Code
Customer /Location Demographic items
Conservation Calculations
Formula Allocation Setup
Demographics
The formula allocation set begins with the creation of the Demographic Categories. The demographic category determines the demographic type (Customer, Location or Account) which the demographic items are assigned. The demographic type determines how the demographic items are linked in the system.
A customer demographic type follows the customer from location to location. An example of the customer demographic is number of children.
The location demographic type remains at the location regardless of which customer. An example of the location demo graphic is in door square footage, lot size, or number of hotel rooms. These values do not normally change from customer to customer.
The account demographic type links the value to a specific customer at a specific location. These values must be set for every customer when they move into a location. The values are only used for this customer at the location.
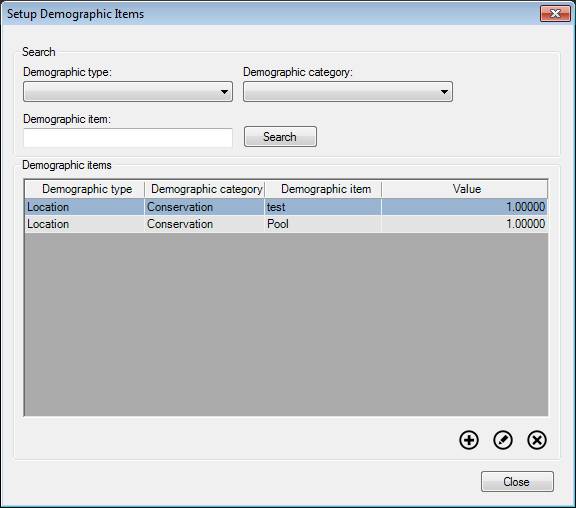
After the demographic types are defined, demographic items are added to the categories. The demographic items are the variables for the formulas. You must know how the formula works so of the pieces will be created. Example demographic items used in the formulas are listed below.
Figure 302: Setup Demographic Items
Allocations
The allocations can be setup with the completion of the demographic items setup. The allocations are setup in the Setup Allocation Type window. Here are some example allocation types.
Figure 303: Setup Allocation Type
Use these steps to add an allocation type:
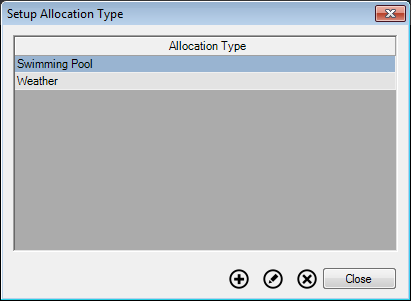
In the Setup Allocation Type window, click Add
to open
the allocation type window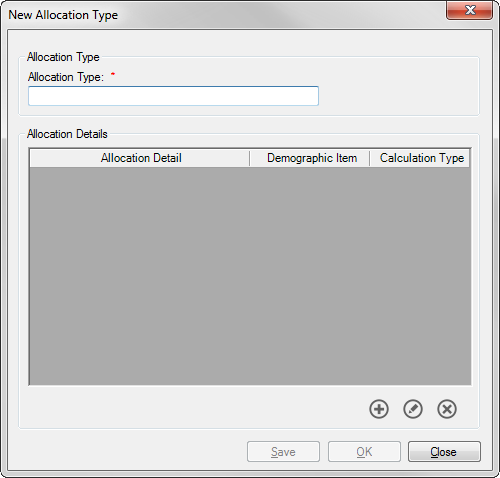
Figure 304: New Allocation Type
Provide a unique descriptive name for the allocation type. The allocation type will be required in the rate code setup
Click Save
The allocation type links the formula(s) and demographic item used to calculate the allocation. The allocation type will be the name that is assigned to the rate code.
Formula Allocation Detail
Now that we have an allocation type we can continue building the formula using these steps:
Click Add
to open the allocation detail window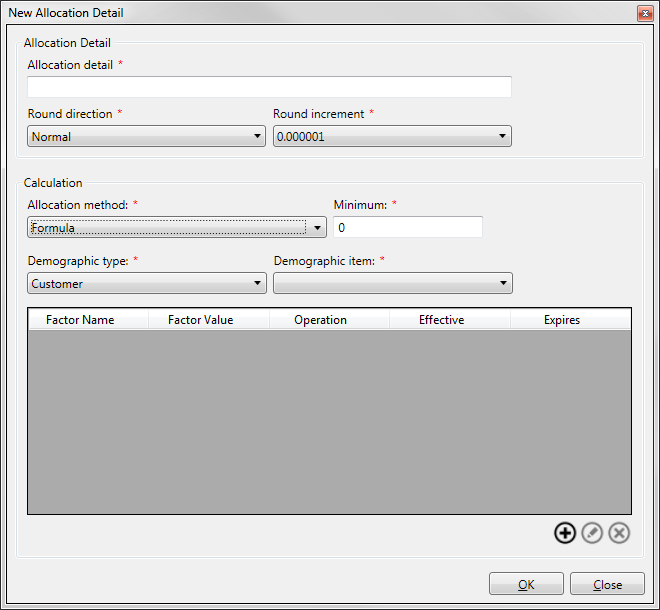
Figure 581: New Allocation Details
Enter an Allocation Detail name
Select the Round Direction. The setting tells the system how to round the calculation
Select the Round Increment. This tells the system what the calculation will be rounded to
Select Formula in the allocation method. This enables the formula builder
Enter the Minimum allocation. The minimum is the allocation that is used when the calculated allocation is less than the minimum allocation or when there is no allocation calculated
Select the Demographic type. This filters the demographic item selection
Select the Demographic Item that is used in this formula
Click Add
to open the factor window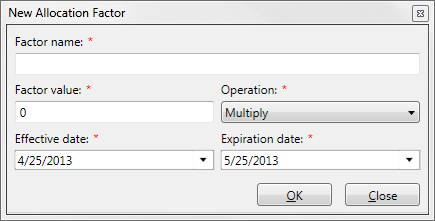
Figure 582: New Allocation Factor
Enter a unique Factor Name
Enter a number for the Factor Value. The factor value will be multiplied by the selected demographic value
Enter the Effective Date Range. If this factor never expires enter a date of 12/31/2050
Click OK
The formula can contain several factors that are multiplied together to determine the allocation detail final allocation for a customer. To add additional factors repeat allocation detail steps. Each factor has its own effective dates. The factors can be mixed between expiring and non-expiring. An example of mixed factors is listed below.
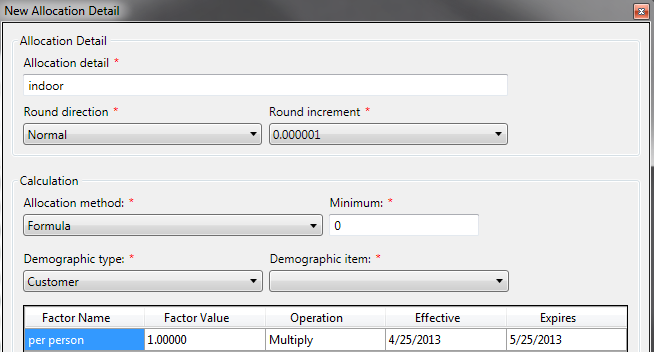
Figure 583: New Mixed Allocation Factors
An allocation type may contain multiple allocation details. All of the allocation details are used to determine the customer’s final allocation number. The allocation type example below determines the customer’s allocation from an Indoor, Outdoor and Irrigation formulas.
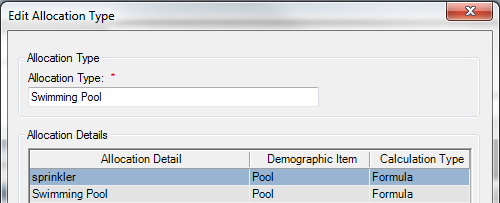
Figure 584: Multiple Allocation Details
Average Allocations
The Average Allocation method uses historical usage information to calculate allocations. Use the average allocation checklist to guide you through the setup requirements.
Setup Checklist for Average Allocations
Allocation Setup
Allocation type
Allocation Method Formula
Average Type
Average calculation type
Average periods
Rate Code
Conservation Calculations
Average Allocation Setup
Use these steps to add an allocation type:
In the Setup Allocation Type window, click Add
to
open the allocation type windowFigure 585: New Allocation Type
Provide a descriptive name for the allocation type
Click Save
The allocation type links average definition used to calculate the allocation. The allocation type will be the name that is assigned to the rate code.
Average Allocation Detail
Now that we have an allocation type we can continue the average allocation using these steps:
Click Add
to open the allocation detail window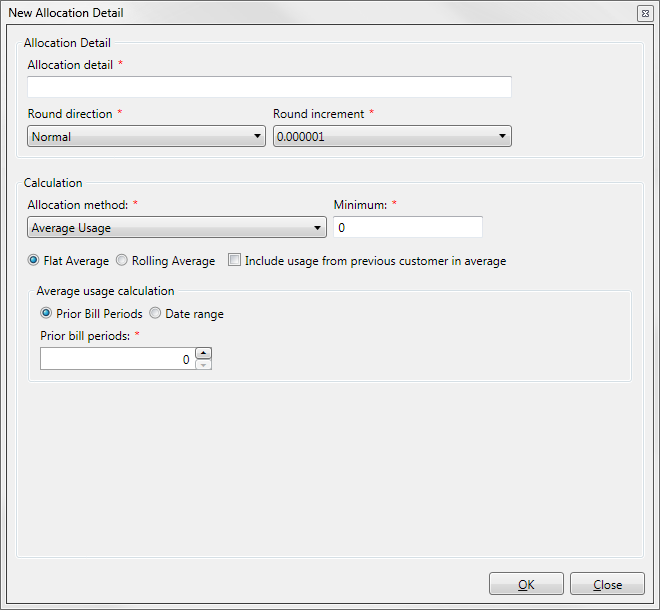
Figure 586: New Average Usage Allocation Detail
Enter an Allocation Detail Name
Select the Round Direction. The setting tells the system how to round the calculation
Select the Round Increment. This tells the system what the calculation will be rounded to
Select Average in the Allocation Method
Enter the Minimum allocation. The minimum is the allocation that is used when the calculated allocation is less than the minimum allocation or when there is no allocation calculated
Select the Average Type
Flat Average. This averages all the usage within the billing period
Rolling Average uses the same bill periods usage within the billing period. In order words, The March billing would average usage the occurred in March only for the defined number of periods
The “Include usage from previous customer in average” checkbox determines which history is used to calculate the average
Checked: The allocation is the average usage for any customer within the time period As the new customer builds history the old customer history is dropped out of the average
Un-Checked: The allocation averages only the current customer’s history
Select the Average Usage Calculation period
Prior Bill Periods requires the number of past bill period that is used to average. This uses the prior billing from the current billing
Date Range requires a From and Through dates. These are fixed dates that may require periodic updating for correct allocations
Click OK to save the allocation detail
Rate Code Setup
The Allocation by Tier rate code is almost identical to the Consumption rate codes. The main differences are in the Consumption Details tab and in the Consumption tier setup.
On the consumption details, the allocation type selection is required. This is a list of allocations that were created in the allocation type setup. Select the allocation type that is used by this rate code.
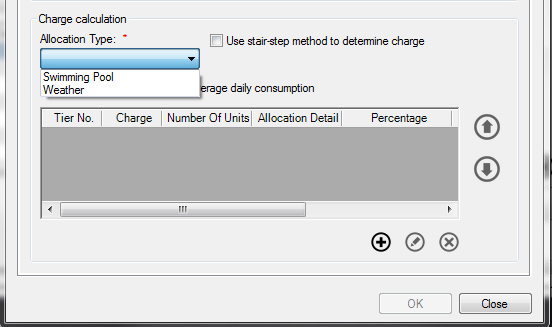
Figure 587: Setting up Rate Codes By Allocation Type
Consumption Tiers
The consumption tiers have options that the regular consumption tiers. Use the following steps to add a consumption tier:
Click Add
to open the allocation consumption tier
window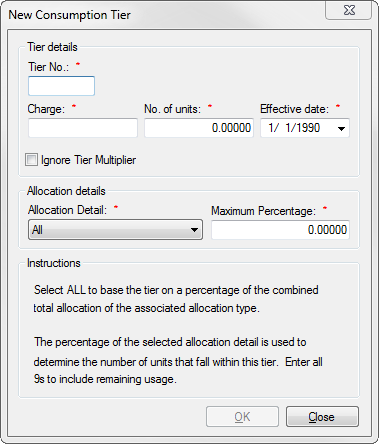
Figure 588: New Consumption Tier
Enter the Tier Number, Charge, Number of Units, and Effective Date just as on a regular consumption tier
Select the Allocation Detail
All is the default selection. All means use the combined total allocation calculation to determine the tier’s allowed usage
The allocation type’s allocation details make up the other list items. A single list item can be selected to determine the tier’s allowed usage
Select the Maximum Percentage. The default is 100%. The percentage of the selected detail item is used to determine the number of units for the tier
Click OK to save the tier
Repeat the step until the require tiers are entered (this is normally 2 tiers normal usage tier and penalty tier but there could be other tiers).
Demographic Items on the Customer Control Panel
The control panel is used to add and set the demographics used in the conservation calculations.
Retrieve the customer and select the Demographics tab.
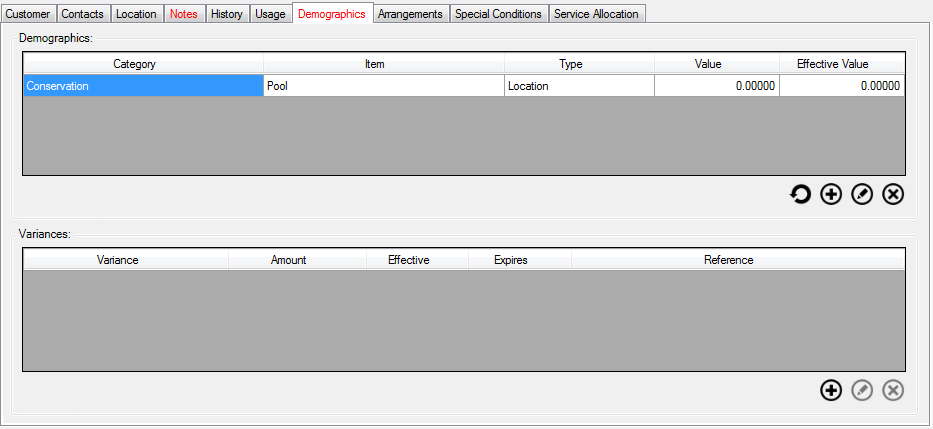
Figure 589: Customer Control Panel - Demographics Tab
Use the following steps to add a demographic item:
Click Add
under demographics to open the Demographic
Details window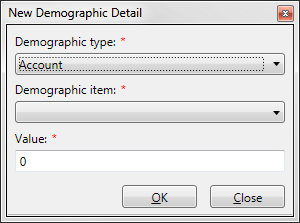
Figure 590: New Demographic Detail
Select the Demographic Type
Select the Demographic Item
Enter the Value for the item
Click OK
Variances
There are times when the calculated allocation is not enough for a customer. Variances provide the ability to change the calculated allocation to meet the needs of the customer. Use the following step to add a variance:
Click the Add
button under variances to open the
Demographic Variance window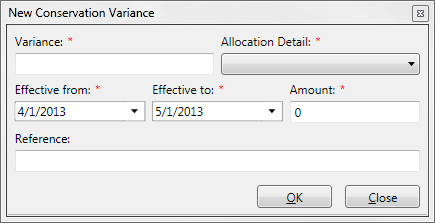
Figure 591: New Conservation Variance
Enter a Variance Name
Select the Allocation Detail that the variance is applied
Set the Effective and Expiration dates. If the variance never expires enter 12/31/2050 as the expiration date
Enter a Variance Amount. The variance amount may be positive to increase the allocation or negative to decrease the allocation
The Reference is optional. Enter why the variance was given in the reference
Click the OK button to close the window
The variances will be applied to the selected demographic detail item to increase or decrease the allocation. Multiple variances may be added and they can be mixed between expiring and non-expiring variances. If the Allocation type has multiple detail item and the variance must be added to each demographic detail item.
After all the demographic items and variances have been added, the next step is to calculate the allocations.
Calculating Allocations
The Conservation Allocation must be calculated prior to calculating bills. The calculations create the allocations for the demographic items including the variances through a future date. The calculations are created outside of the billing process to improve bill calculation performance.
Group Calculations
The allocations are created in groups by using the Calculate Conservation Allocations window.
Figure 592: Calculating Conservation Allocations
Use these step to calculate the allocations:
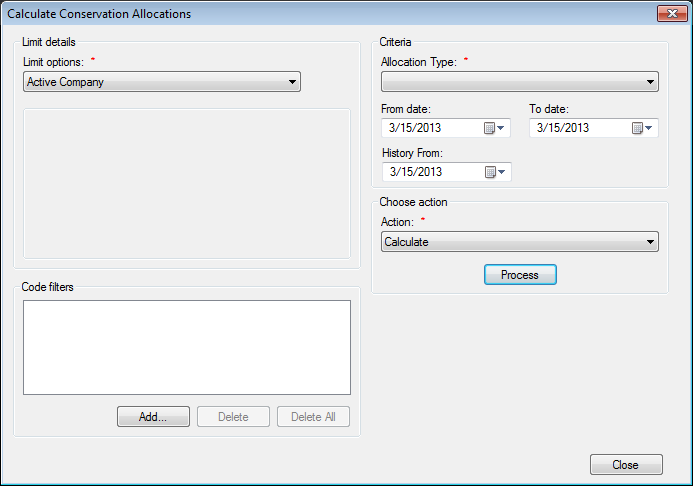
Select the Limit Options from the standard limits
Select the Allocation Type
Enter the From Date. This is the start point from which the allocations will be created
Enter the To Date. This is the future date that the allocation will be created
Enter the History From Date. This date must be equal to or before the From Date
Click Process to begin the calculation
If there are existing calculations for the date range, they will be replaced with the new calculations.
Individual Calculations
The Conservation Allocation can be calculated for an individual from the Utility Maintenance window. Use these steps to calculate an individual from the Utility Maintenance window:
Retrieve the Customer
Click on the Location tab
Double click the Utility that uses conservation billing to open the Utility Maintenance window
Click on the Conservation tab to see the allocation details
Click the Calculator button to open the Calculate Conservation Allocations window
Enter the From Date
Enter the To Date
Enter the History From Date
Click OK to calculate
Calculation Samples
This is a sample calculation for the allocation and the charges that are calculated based on a sample rate.
This is an example of the sample formula allocation which has 3 allocation detail rows. Each allocation detail has multiple factors:
Description |
Minimum |
Factor 1 |
Factor 2 |
Factor 3 |
Factor 4 |
Factor 5 |
Factor 6 |
|---|---|---|---|---|---|---|---|
SFR Indoor |
5 |
5 |
0.01724 |
||||
SFR Outdoor |
7 |
0.6 |
0.62 |
0.01724 |
0.8 |
8.038 |
0.00134 |
SFR IRR |
6 |
0.62 |
0.8 |
0.00134 |
0.01724 |
The rate code has 2 tiers that are in effect for the calculation. The first tier bills the usage up to the calculated allocation and any remaining usage is billed in the 2nd tier.
|
|
The allocation calculation uses the days in service to determine the final allocation.
The customer’s demographic item values are:
Demographic Item |
Value |
Final Allocation |
|---|---|---|
SFR Indoor |
3 |
15 |
SFR Outdoor |
6125 |
20 |
SFR IRR Formula |
480 |
6 |
Total Allocation |
41 |
From these values the calculated charges are:
Total billed usage 60 |
Tier Charge |
Tier Usage |
Tier Calculation |
|---|---|---|---|
Calculation Tier 1 |
3.66 |
41 |
150.06 |
Calculation Tier 2 |
6.10 |
19 |
115.90 |
Total |
265.96 |
Change the customer’s usage does not change the allocations. The usage changes cause dramatic changes in the customer’s bill. A 50% usage increase almost doubles the customer’s bill.
Total billed usage 90 |
Tier Charge |
Tier Usage |
Tier Calculation |
|---|---|---|---|
Calculation Tier 1 |
3.66 |
41 |
150.06 |
Calculation Tier 2 |
6.10 |
49 |
289.90 |
Total |
448.96 |
A customer reducing their usage causes a dramatic reduction in their bill.
Total billed usage 20 |
Tier Charge |
Tier Usage |
Tier Calculation |
|---|---|---|---|
Calculation Tier 1 |
3.66 |
20 |
73.20 |
Calculation Tier 2 |
6.10 |
0 |
0 |
Total |
73.20 |
Any change to the factors, days in service or variances changes the allocation which in turn changes the calculated bill.If a variance of 10 is added to the indoor allocation detail item the total allocation increases to 51 and the bill would change for the same usage:
Total billed usage 60 |
Tier Charge |
Tier Usage |
Tier Calculation |
|---|---|---|---|
Calculation Tier 1 |
3.66 |
51 |
186.66 |
Calculation Tier 2 |
6.10 |
9 |
54.90 |
Total |
241.56 |
So a 10 unit change in the variance causes a $24.40 change in the bill for this rate code.
This is a sample calculation for the allocation and the charges that are calculated based on a sample rate.